If you’re seeing unexpected spikes or drops in your performance data, it’s easy to worry about tracking errors. But often, these changes are actually seasonal trends—regular, predictable patterns tied to holidays, industry cycles, or weather shifts. Seasonal trends usually follow a consistent calendar rhythm, while tracking errors tend to be sudden and irregular. Understanding these differences helps you trust your data and avoid chasing false problems.
Why does my performance data suddenly spike or dip at certain times?
Seasonal trends cause your performance data to rise or fall at similar times each year because of changes in consumer behavior, business cycles, and external influences like holidays or weather. For example, retail sales often surge during the holiday shopping season in November and December, then drop afterward. Travel sites typically see more traffic in summer when people plan vacations. Other industries might experience shifts based on fiscal years or school calendars. These predictable patterns usually appear as smooth, recurring waves or spikes aligned with specific calendar events.
Could this be a tracking error instead of a seasonal trend?
Not every unusual data pattern is seasonal. Tracking errors can mimic seasonal shifts and cause confusion. Common tracking issues include broken or missing tracking codes, which cause sudden drops; data gaps from server outages or delays; and attribution problems where conversions get assigned incorrectly, leading to unexpected jumps or falls. Unlike seasonal trends, tracking errors usually produce abrupt, isolated changes without a clear pattern or connection to known events. They may affect only certain channels or timeframes. Always check your tracking setup and data quality before assuming a pattern is seasonal.
How can I tell if a trend is seasonal or a tracking glitch?
Seasonal trends repeat regularly and align with external events like holidays or weather changes. They often last days or weeks and look similar year after year. Tracking glitches tend to appear suddenly, may not repeat, and cause sharp drops or spikes unrelated to any calendar event. To tell the difference, look for consistency: Does the pattern occur around the same time each year? Seasonal trends usually affect multiple related metrics and channels, while errors often impact just one source. Cross-check your data against industry events or external calendars to confirm seasonality.
What historical data should I review to confirm seasonality?
To be sure a pattern is seasonal, examine multiple years of data. One year’s data might include one-off events that don’t reflect a real trend. Reviewing two or three years helps spot recurring peaks or dips during the same periods. Check different timeframes—daily, weekly, or monthly—to see if the pattern persists consistently. Comparing similar periods, like Black Friday weekends or summer months, reveals genuine seasonality. If a pattern doesn’t repeat or appears only once, it’s more likely an anomaly or error than a seasonal trend.
Are there tools or software features that help detect seasonal trends?
Many analytics platforms offer tools to identify seasonality. Time series decomposition breaks data into trend, seasonal, and irregular parts, making it easier to spot repeating patterns. Anomaly detection highlights unusual data points that differ from expected seasonal behavior. Calendar overlays mark holidays or industry events on charts, helping link data changes to real-world happenings. Some software provides seasonally adjusted metrics that remove typical seasonal effects, revealing underlying trends. These features speed up analysis and help distinguish seasonal trends from errors.
How do I adjust my dashboards and reports to reflect seasonal effects?
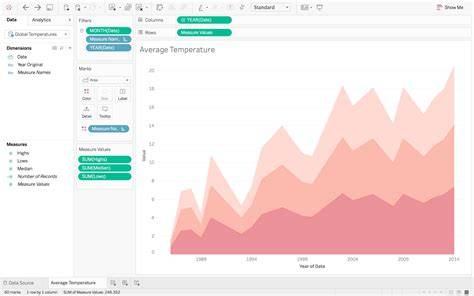
Adjusting your dashboards for seasonality prevents misreading normal fluctuations as problems. Use seasonally adjusted metrics or set benchmarks based on historical seasonal performance so your expectations match typical ups and downs. For example, compare this December’s sales not to last month but to December in previous years. Highlight seasonal periods visually in reports to remind viewers that certain patterns are expected. Adjust KPIs to reflect these cycles, avoiding false alarms from normal drops or surges. This makes your reports clearer and reduces confusion about natural seasonal changes.
What common mistakes do people make when interpreting seasonal data?
Many people overlook seasonality and treat every fluctuation as a performance issue, which can lead to unnecessary panic or poor decisions. Others overreact to normal seasonal ups and downs, like cutting budgets during expected slow months. Some confuse tracking errors with seasonal trends without checking properly. Another common mistake is relying on too little historical data, mistaking random spikes for seasonal patterns. Avoid these errors by seeking regular, repeating patterns, verifying data accuracy, and setting realistic expectations based on past cycles.
How can I communicate seasonal impacts clearly to my team or stakeholders?
When sharing data, explain seasonal trends upfront. Use charts that overlay seasonal events or show multiple years side by side to highlight repeating patterns. Clarify why certain spikes or dips are normal and don’t signal problems. Clear, jargon-free communication prevents confusion during meetings. Summaries that highlight seasonal effects help stakeholders understand when to expect fluctuations and how you’re adjusting strategies accordingly.
What should I do if I suspect actual tracking errors?
If you suspect tracking errors, start by reviewing your tracking code across all pages and platforms. Use debugging tools or browser extensions to verify that scripts fire correctly. Look for sudden data drops or gaps and cross-check with server logs or deployment timelines. Test key user actions to confirm events are tracked properly. Fix any issues you find and monitor data closely afterward to ensure accuracy. Document changes and communicate with your team to prevent repeated errors. Regular audits of your tracking setup help avoid future problems.
How can I prepare for upcoming seasonal trends to improve performance?
Understanding seasonality helps you plan campaigns and allocate resources more effectively. Use historical data to forecast busy and slow periods, then schedule marketing efforts accordingly. Increase budgets, staff, or inventory during peak seasons to meet demand. During slower times, focus on cost-saving or customer retention. Testing new strategies before seasonal peaks can optimize results. Planning ahead reduces surprises and helps you make the most of predictable shifts instead of reacting after they occur.
Conclusion
Start by comparing your recent data with past years to see if fluctuations match known seasonal events. Ignore sudden, isolated changes without a clear pattern until you’ve ruled out tracking errors. The goal is to confidently explain your data’s ups and downs as natural seasonality or fix errors quickly. Once you recognize these patterns, you’ll spend less time chasing false alarms and more time making decisions that genuinely improve your results.
Frequently Asked Questions
How often do seasonal trends repeat in performance data?
Seasonal trends usually repeat annually or within regular timeframes tied to calendar events like holidays or weather cycles. Some industries have multiple seasonal peaks per year, while others follow fiscal quarters or school terms.
Can tracking errors cause data spikes similar to seasonal trends?
Yes. Tracking errors such as broken code or data gaps can cause sudden spikes or drops that look like seasonal changes but usually lack consistent timing or alignment with known events.
What’s the quickest way to check if a data dip is seasonal?
Compare that period to the same time in previous years. If a similar dip happens regularly around that time, it’s likely seasonal rather than an error.
Should I always adjust KPIs for seasonality?
Adjusting KPIs for seasonality helps set realistic expectations and avoids misinterpreting normal fluctuations as problems, especially when your business has strong seasonal cycles.
What’s a simple tool to visualize seasonality in my data?
Many analytics platforms offer calendar overlays or time series decomposition features that separate seasonal patterns from overall trends and anomalies, making it easier to identify regular cycles.