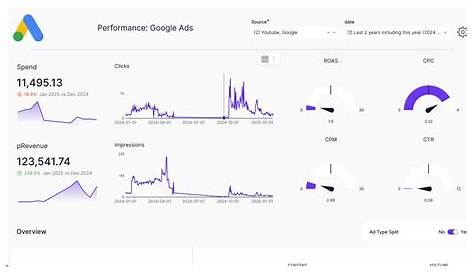
Measuring the performance of your Google Ads product feed campaigns means focusing on the right metrics that show real business results, not just clicks or impressions. The most useful indicators are return on ad spend (ROAS), conversion rates, and impression share, which together reveal how well your ads turn interest into sales and whether you’re reaching enough shoppers. Using reports from both Google Ads and Google Merchant Center gives you a fuller understanding of how your product feed and ads work together to drive revenue and profit. With these insights, you can confidently identify what’s working and where to optimize your campaigns for better returns.
What’s the most important metric to focus on for product feed campaigns?
Return on ad spend (ROAS) is the single most important metric for product feed campaigns because it directly measures how much revenue you earn for every dollar spent on ads. Conversion rate is also key, showing what share of clicks lead to purchases and helping you evaluate ad relevance and landing page quality. Impression share reveals how often your ads appear compared to the total possible impressions, which tells you if your bids or budget are limiting your reach. While clicks and cost-per-click provide some insight, they don’t show whether those clicks turn into sales. Focusing on ROAS, conversion rate, and impression share together gives you a clearer picture of your campaign’s success and where you can improve.
How do I access and understand performance data in Google Ads?
In Google Ads, go to the Campaigns tab and filter for your product feed campaigns to see key metrics like clicks, impressions, cost, conversions, and ROAS on the Overview page. For more detail, use the Dimensions tab or Reports to break down performance by product, device, location, or time. The Product Groups report is especially useful for spotting which SKUs or categories perform well or poorly. Make sure to add columns for conversion value, ROAS, impression share, and conversion rate if they’re not visible. Tracking these metrics over different time periods helps you notice trends and respond quickly. Also, pay attention to the quality of conversions, not just their quantity, by looking beyond clicks at revenue and purchase behavior.
Why should I connect Google Merchant Center data to my analysis?
Google Merchant Center stores your product feed data and linking it with Google Ads lets you see issues that affect ad delivery and performance. Merchant Center reports highlight problems like disapproved products, feed errors, or missing attributes that might be stopping some items from showing. For example, if a product has plenty of stock but low impressions, Merchant Center might reveal a feed error or policy violation blocking it. It also provides search query reports showing which shopper searches triggered your ads, helping you understand user intent and optimize your feed and bids. Combining Merchant Center and Google Ads data gives you a fuller picture to troubleshoot problems and improve your campaign’s reach and effectiveness.
What common mistakes do people make when reading product feed campaign results?
A frequent mistake is focusing too much on clicks without checking if those clicks turn into sales. High traffic with low purchases often means your ads aren’t relevant or your landing pages need work. Another error is ignoring product-level data and only looking at overall campaign numbers. Since product feed campaigns are granular, some products might perform well while others drag down results, so segmenting by product is crucial. People also overlook impression share, missing signs that budget or bids are limiting visibility. Finally, treating cost-per-click as a success metric without considering profit margins can lead to overspending on unprofitable clicks. Always interpret metrics in context to get a true sense of performance.
How can I measure the real ROI of my product feed ads, not just clicks?
To measure real ROI, track actual conversions and assign them meaningful revenue values, not just count sales. Set up conversion tracking in Google Ads and link it to your store’s purchase confirmation page, making sure each conversion includes the correct revenue amount. ROAS then reflects the total revenue generated compared to ad spend. Consider profit margins because revenue alone doesn’t show profitability; a high-value sale with a slim margin might be less valuable than multiple moderate sales with healthy margins. If possible, factor in returns or lifetime customer value for a more accurate picture. Tools like Google Analytics help you understand what users do after clicking your ads, giving insight into conversion quality. This way, you focus on ads that generate profitable sales, not just clicks.
Are there specific benchmarks or goals I should set for my campaigns?
Benchmarks vary widely by industry, product, and audience, so use your own past performance and competitive context to set goals. A ROAS around 400% (or 4:1 revenue to ad spend) is a common starting point for many e-commerce product feed campaigns, though high-margin products might aim higher. Typical conversion rates for product ads are usually between 2% and 5%, but your experience may differ. For impression share, aiming above 70% generally means good visibility. Instead of chasing arbitrary numbers, focus on steady improvement and comparing similar products or periods. Keep seasonal and promotional effects in mind when adjusting your benchmarks.
What role does product feed quality play in campaign performance?
Product feed quality is the foundation of your campaign’s success. If your product data is inaccurate, incomplete, or outdated, Google can’t match your ads effectively to shoppers’ searches. Missing important details like GTINs, unclear titles, or weak descriptions reduce ad relevance and can cause disapprovals. High-quality feeds with optimized titles, clear images, and competitive prices improve your chances of winning auctions and securing good ad placements. Keeping your feed fresh is also vital—out-of-stock or discontinued items waste budget and frustrate shoppers. Regularly audit your feed, fix errors reported in Merchant Center, and update product info to keep your ads running smoothly and performing well.
How do seasonality and promotions impact my feed campaign results?
Seasonality and promotions naturally cause performance shifts that can confuse you if you don’t account for them. Some products sell better during holidays or specific times of year, so expect conversion rates, ROAS, and impression share to rise or fall accordingly. Sales events often boost clicks and conversions but might lower average order value or margins because of discounts. Tracking your performance against these periods helps you set realistic expectations. For example, a lower ROAS during a promotion might be fine if you’re gaining volume and brand exposure. Adjust your bids and budgets before seasonal peaks to capture demand, rather than reacting after the fact.
What tools or reports can help me dig deeper into product-level performance?
Google Ads offers several reports for product-level analysis. The Product Groups report breaks down performance by individual SKUs or product groups, helping you identify top and poor performers. Search Query reports show the exact shopper searches triggering your ads, which helps refine keywords and targeting. Auction Insights reveal how you compare to competitors. Merchant Center’s Diagnostics tab highlights feed errors affecting specific products. For deeper analysis, export your data to spreadsheets or BI tools to create custom dashboards. Third-party platforms like Data Studio can connect to your accounts for visual reports. You can also set up custom segments in Google Analytics to understand user behavior beyond the click.
What are practical next steps to improve my product feed campaigns based on performance data?
Start by identifying your best- and worst-performing products in your reports, then raise bids on top sellers and pause or optimize underperformers. Fix any feed problems flagged in Merchant Center quickly to restore ad eligibility. Refresh product titles and descriptions to include relevant keywords and improve clarity. Try adding promotional messaging or custom labels to highlight deals. Test different bidding strategies like target ROAS or enhanced CPC to find the best balance between cost and return. Monitor impression share and budget pacing to avoid missed opportunities. Track your changes over time and remember that optimization is ongoing—it gets better as you gather more data.
Conclusion
Focus on ROAS and conversion rates rather than clicks or impressions alone. Use both Google Ads and Merchant Center reports to understand your product feed’s health and campaign effectiveness. Avoid getting distracted by vanity metrics or ignoring product-level performance differences. Set realistic goals based on your industry and watch for seasonal effects to interpret changes properly. Prioritize feed quality and keep experimenting with bids and creative elements guided by your data. Following these steps will help you gain clearer insights and steadily improve how your product feed campaigns contribute to your bottom line.
Frequently Asked Questions
How do I track conversions specifically for product feed campaigns?
Set up conversion tracking in Google Ads and link it to your store’s purchase confirmation page. Make sure each conversion includes the revenue value so you can directly measure sales from your ads.
Can I use Google Analytics to measure product feed campaign performance?
Yes. Google Analytics complements Google Ads by showing what users do after clicking your ads, including time on site, bounce rates, and multi-channel conversion paths. This helps you assess the quality of conversions beyond just the click.
What should I do if my impression share is low?
Low impression share usually means your bids or budget are too low, or your feed has issues. Try increasing bids, expanding your budget, or fixing any feed errors to improve how often your ads show.
Is it normal for ROAS to fluctuate during sales or holidays?
Yes. Promotions and seasonal demand often lower ROAS because of discounts but increase volume and brand exposure. Use these times to build awareness and adjust your expectations accordingly.
How often should I update my product feed?
Ideally, update your feed daily or whenever your inventory or pricing changes. Keeping it current ensures your ads show accurate information and prevents wasted spend on unavailable or outdated products.